Pizza Console #
The Pizza Console is the built-in web console for a Pizza cluster. It is
embedded in the pizza-server binary at build time, so there is nothing to
install or deploy — every node serves it. Use it to browse the cluster,
manage namespaces and collections, edit settings, and run API requests
from the browser.
Open the console #
With a node running on the default binding, open:
http://localhost:28000/_ui/
Any node in the cluster works — the console talks to the same REST APIs on that node that the Pizza CLI uses.
Sign in #
If security is enabled, the console asks for an API key before it opens.
Paste a key from the node’s configuration (security.keys or the
bootstrap key) — it is validated against /_security/whoami, and the
pages you see depend on the key’s role. There are no user/password
accounts. See
Security for how
keys and roles work.
A tour of the console #
The screenshots below come from a live single-node cluster with real data.
Overview #
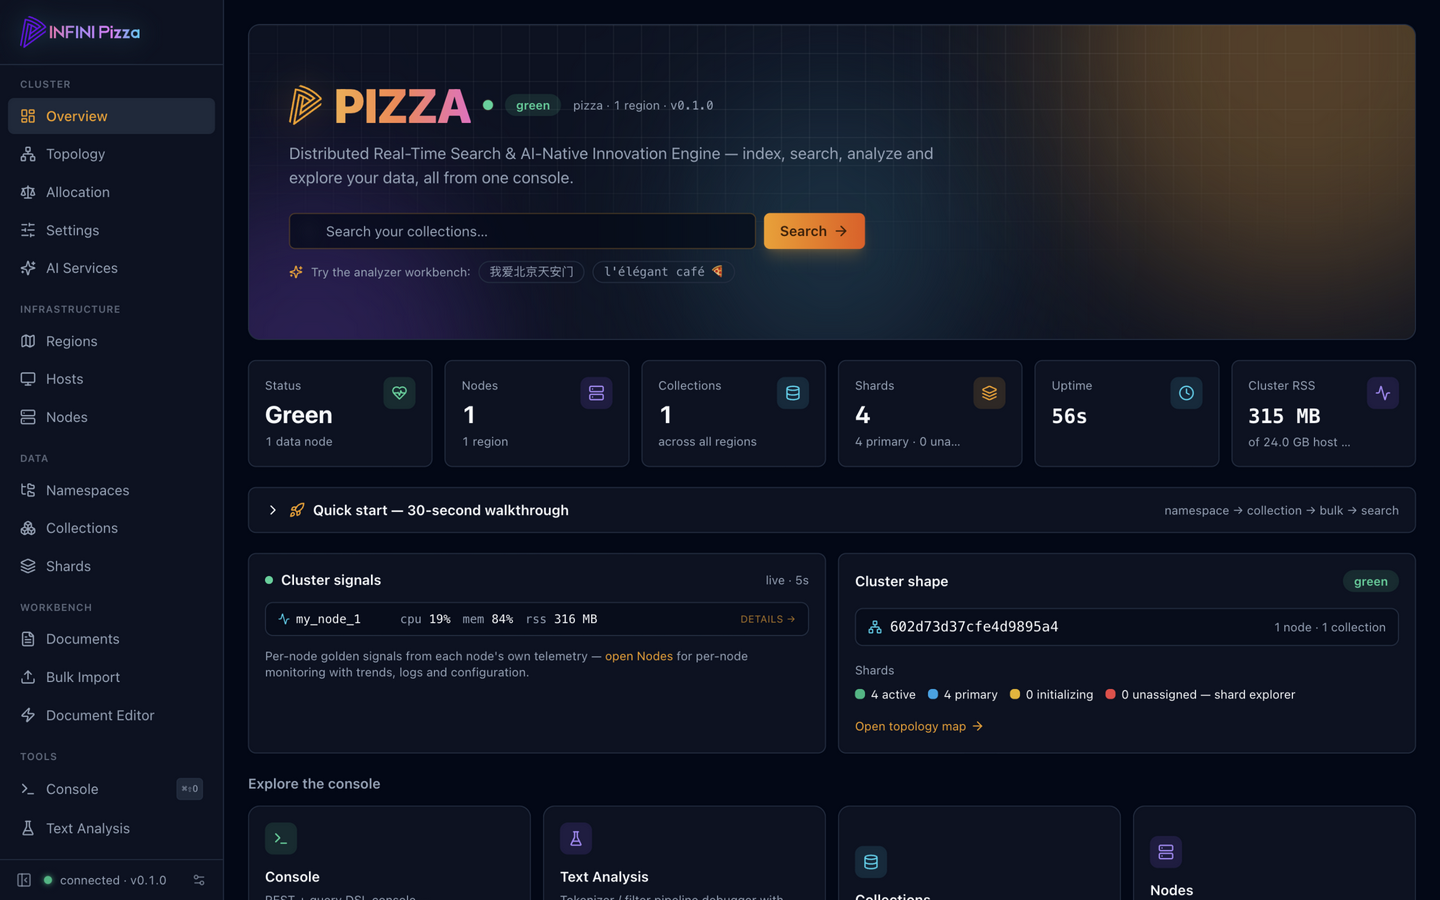
The landing page answers “is the cluster healthy” in one glance: status, node/collection/shard counts, uptime and memory, plus live cluster write and query rates with average latencies. Below the stat cards, per-node golden signals (CPU, memory, RSS) refresh every 5 seconds, and the cluster shape card links into the topology map.
Topology #
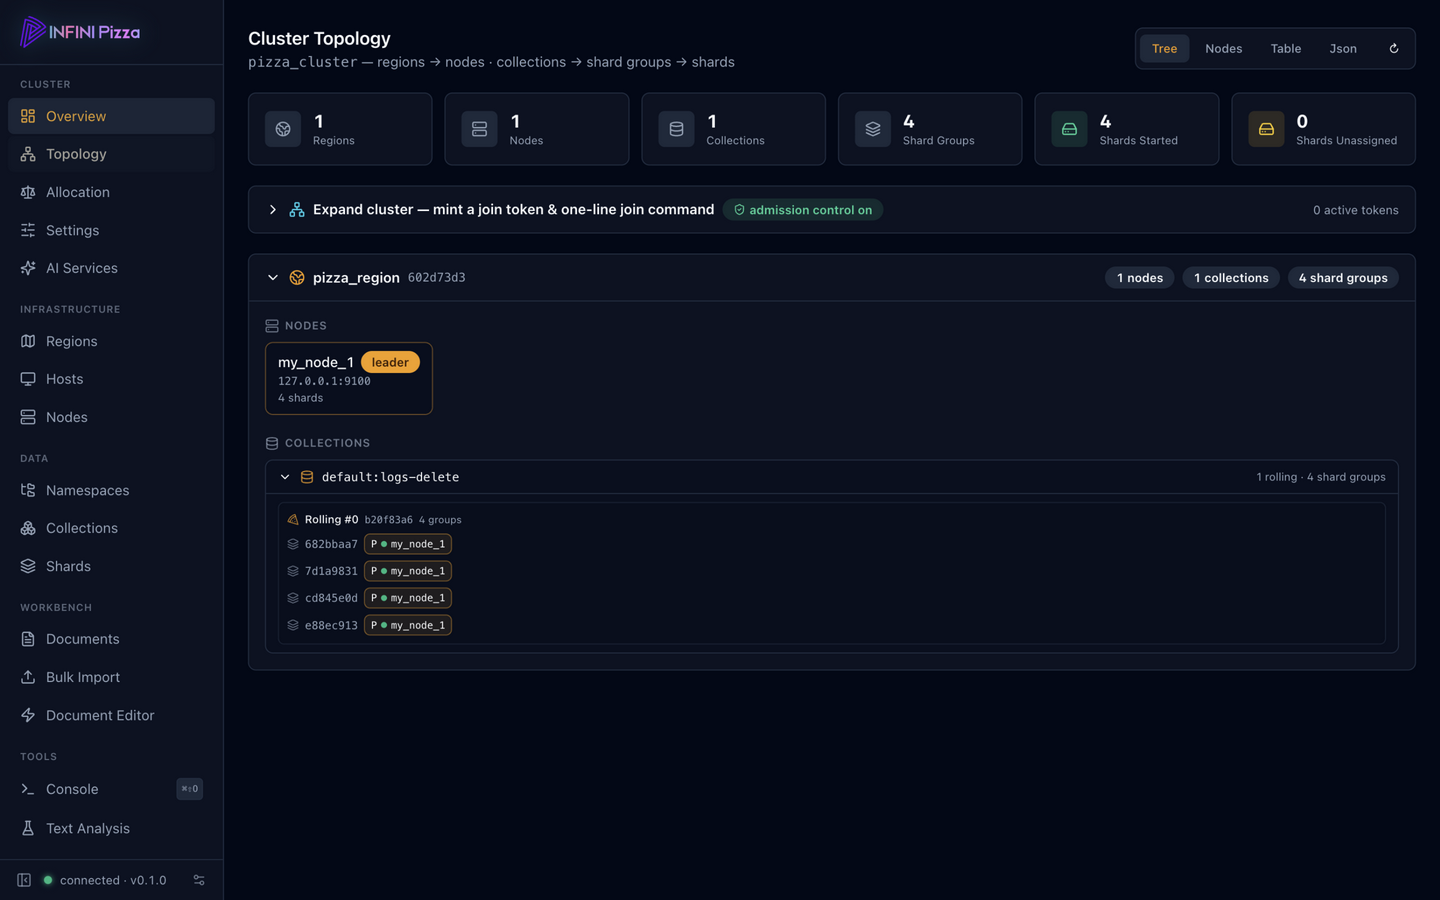
Topology renders the whole cluster as a tree — Cluster → Region → Nodes and Collections → Rollings → Shard Groups → Shards — with primary/replica chips and state colors on every shard. The view switcher (Tree / Nodes / Table / JSON) shows the same data as a per-node shard placement view, a flat table, or raw JSON.
Nodes and node detail #
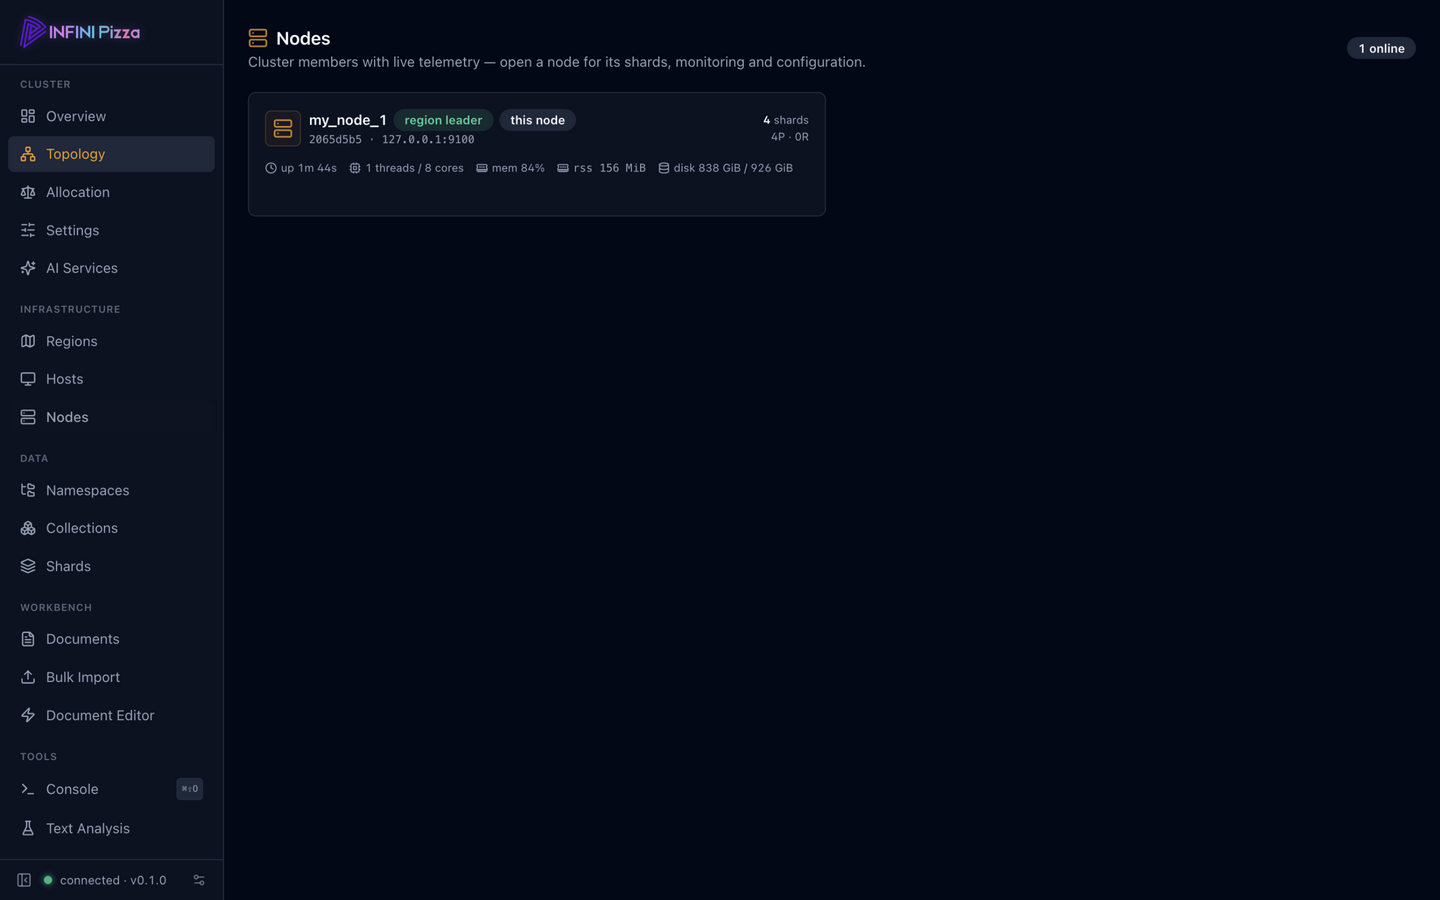
The Nodes page lists every cluster member with live telemetry: shard counts (primaries/replicas), engine threads vs logical cores, system memory, process RSS and data-path disk usage.
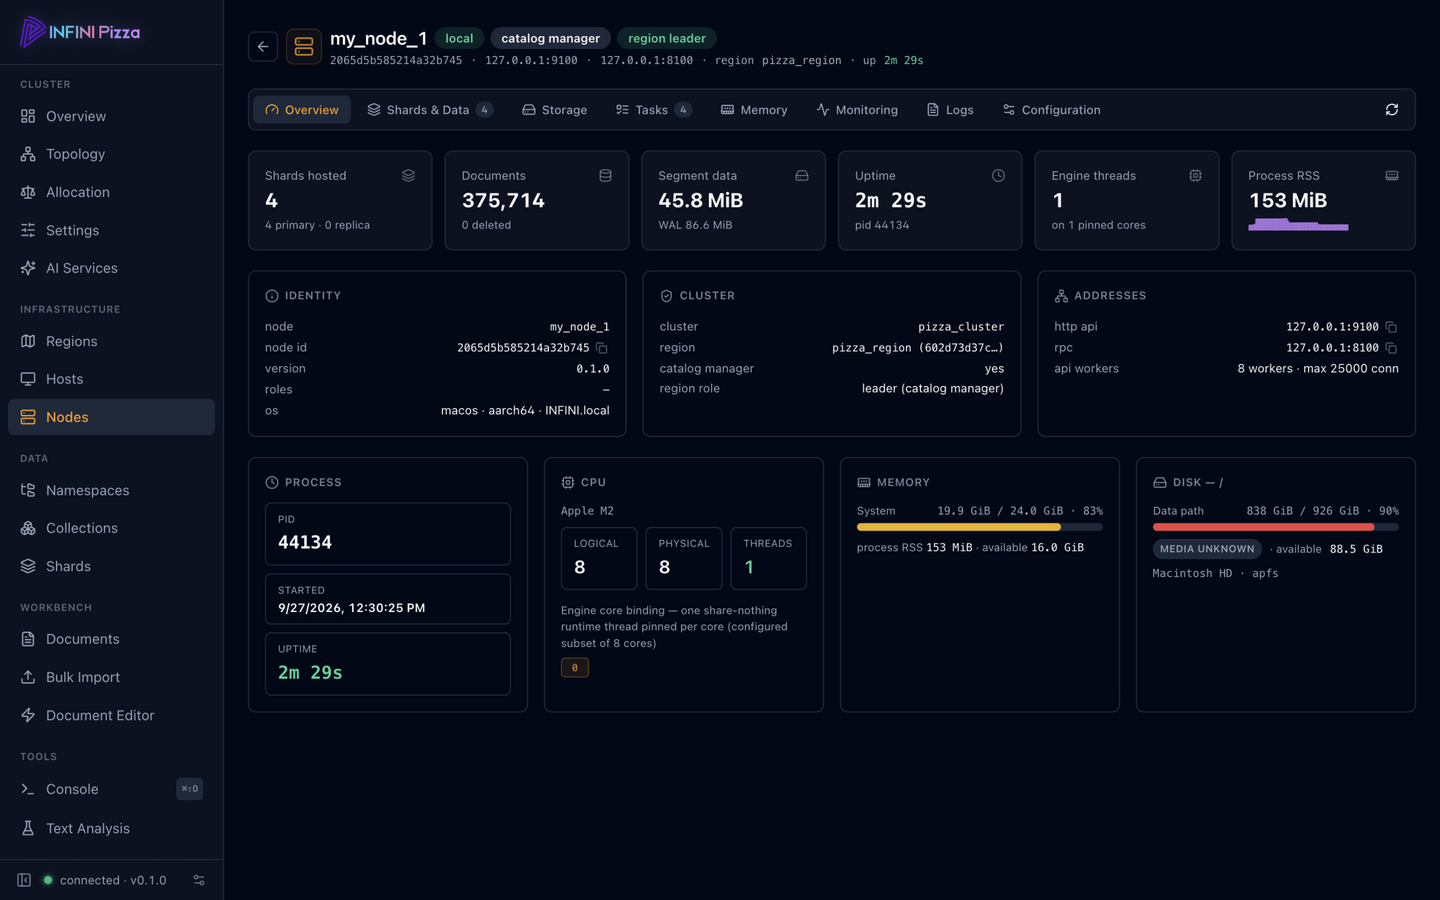
Click a node for its detail page: process identity and uptime, CPU with the engine’s pinned core set, memory and disk usage bars, the shard groups it hosts, monitoring trends, logs, and its runtime configuration.
Namespaces #
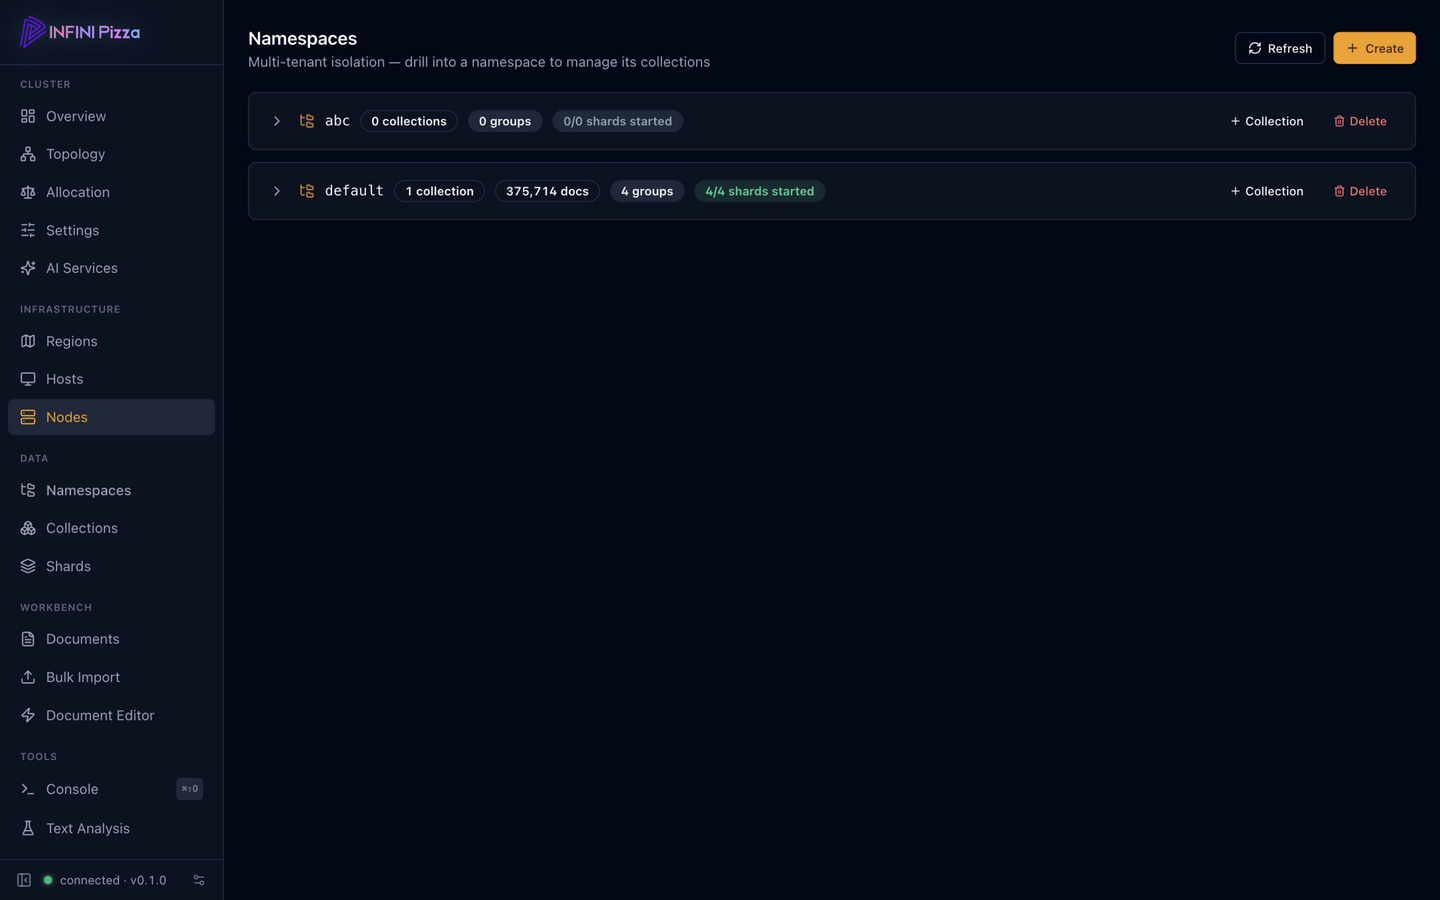
Namespaces group collections — the console drills from namespace to collection with per-namespace shard stats, and can create or delete both. Namespaces are also where access permissions live when security is on.
Collections #
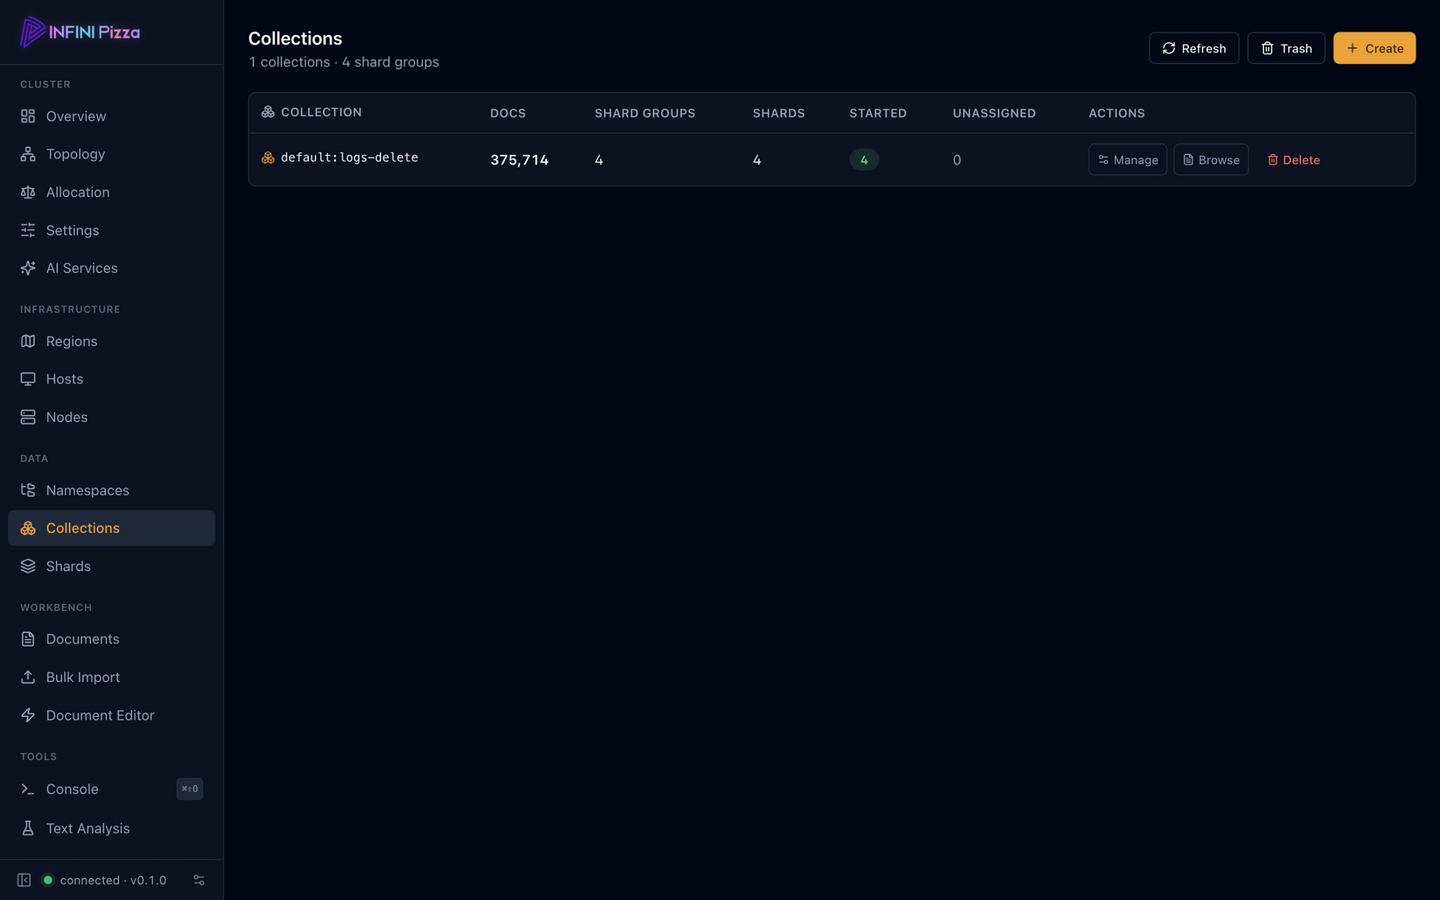
The Collections table lists every collection with its document count and per-collection shard group stats. Manage opens the collection detail page.
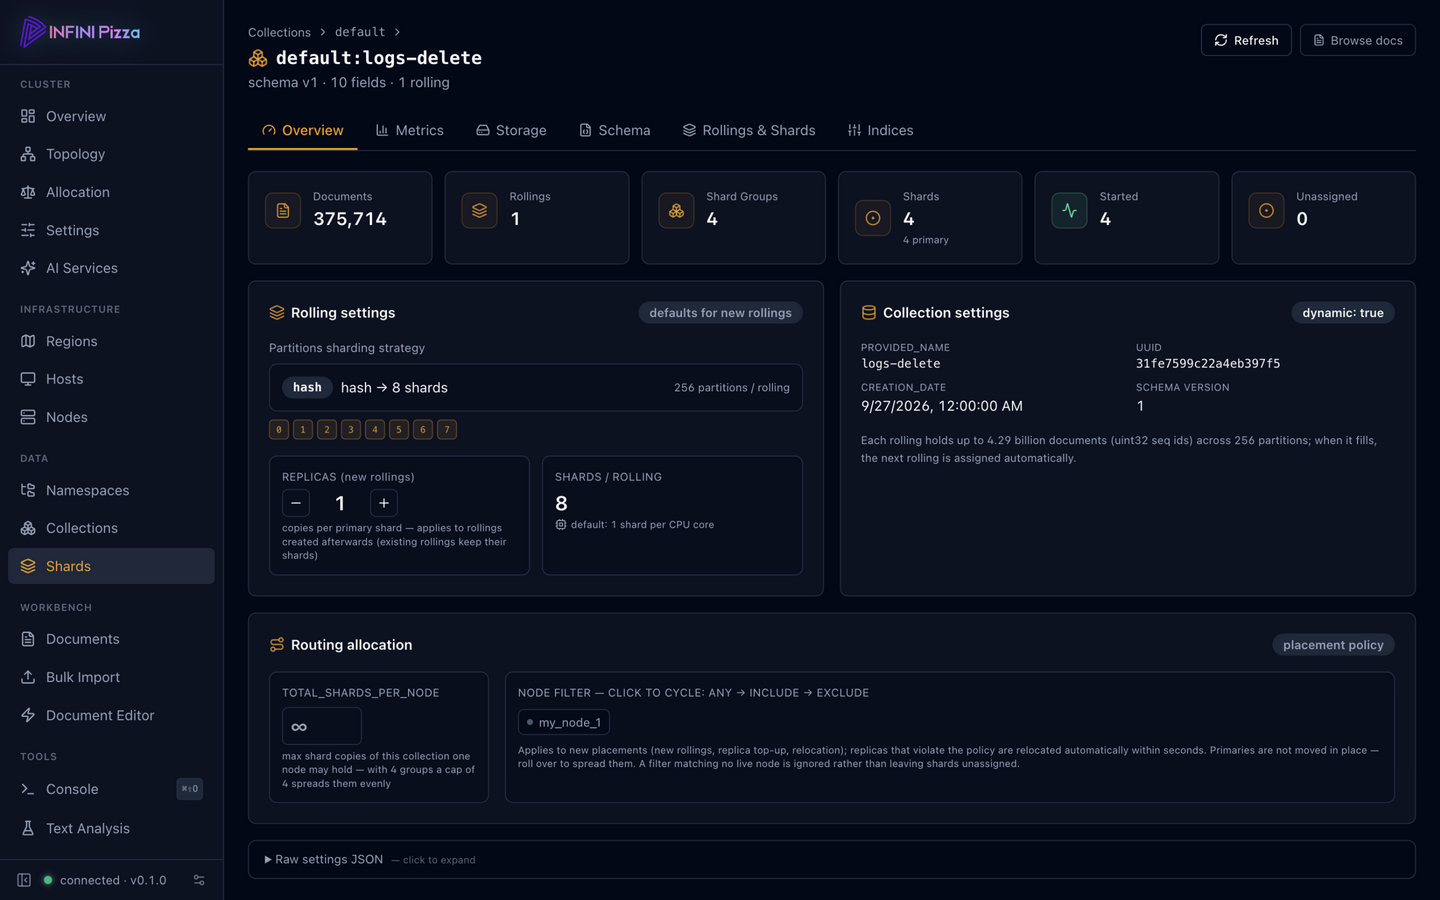
The collection detail page visualizes the settings that decide how the collection is laid out: rolling strategy (with a partition/shard diagram), a replicas stepper for new rollings, and shards-per-rolling — each control explains what it affects before you touch it.
The schema editor #
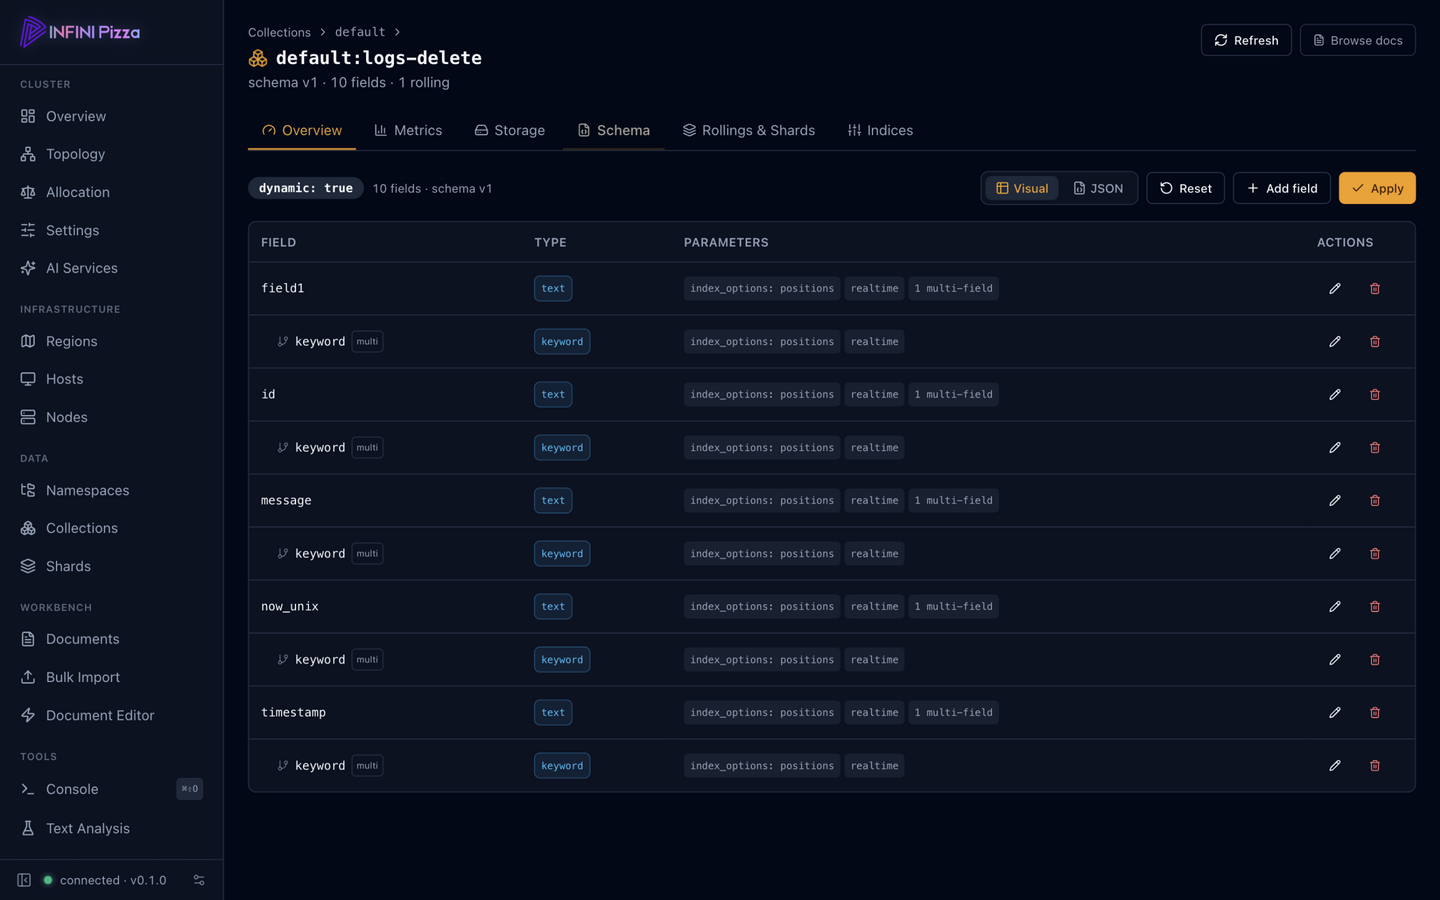
The Schema tab is a visual field editor on top of the raw schema
JSON: browse fields by type, edit the JSON directly, and apply the
additive diff with PUT /<target>/_schema — the same Raft-replicated
path dynamic schema updates take.
Rollings and shards #
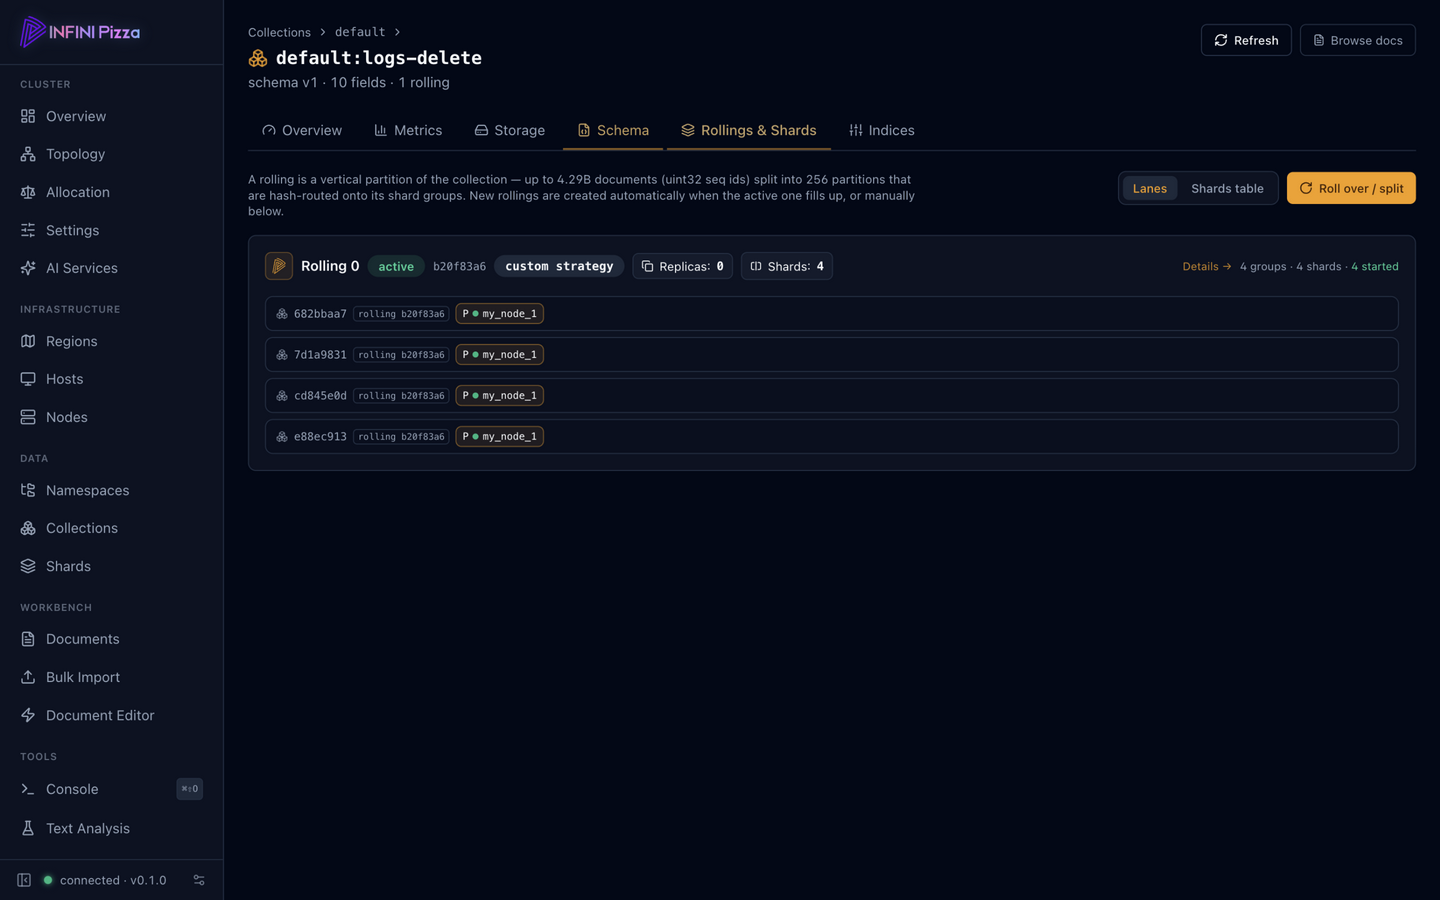
The Rollings & Shards tab shows every rolling with its shard groups
and node placement, in lanes or as a table. From here you can trigger a
manual rollover (POST /<target>/_rolling, with optional shard/replica
overrides for the new rolling) and adjust the replica count of an
existing rolling — both Raft-replicated and safe across restarts.
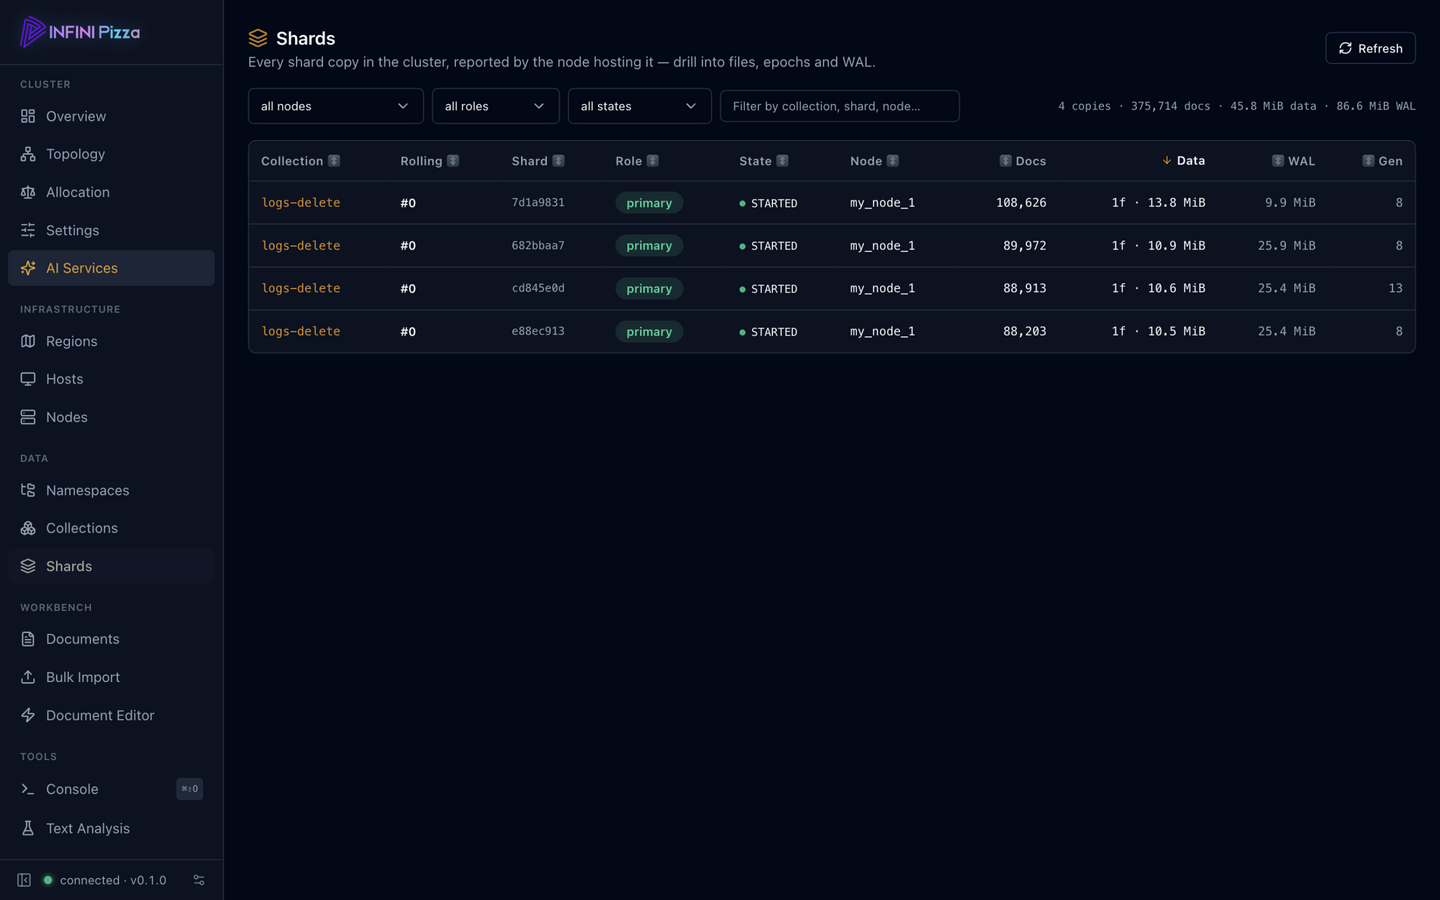
The data-plane Shards page is a cluster-wide shard explorer: filter by collection or state, and drill into a single shard’s files, epochs and WAL.
Documents #
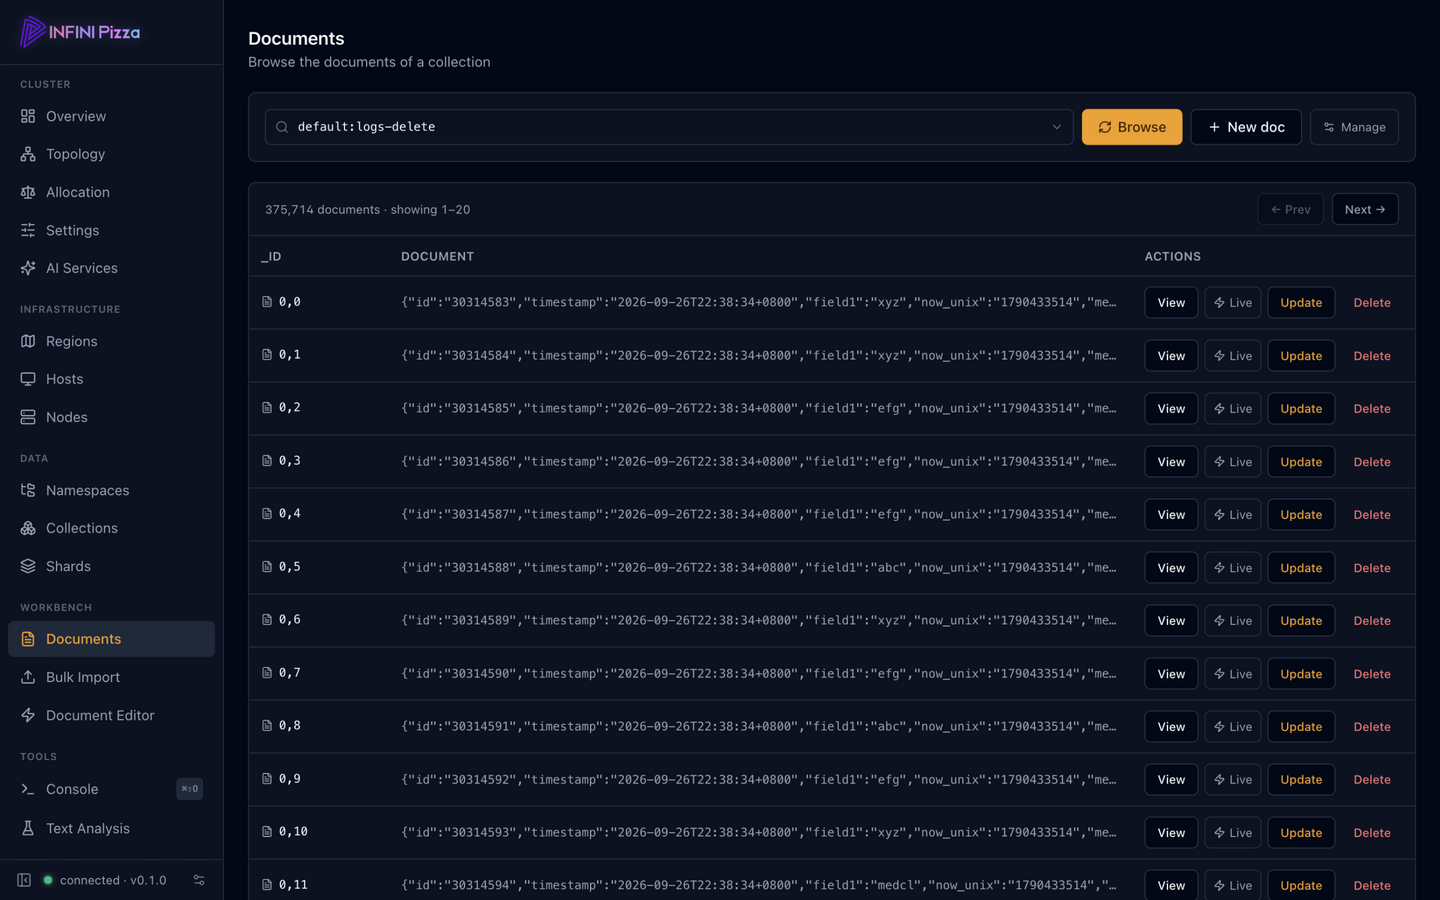
The Documents page browses a collection’s documents with a searchable collection picker (no typing full names blind), pretty JSON documents, and per-document view/delete plus a new-document composer. Bulk Import takes NDJSON with the same picker.
The API console #
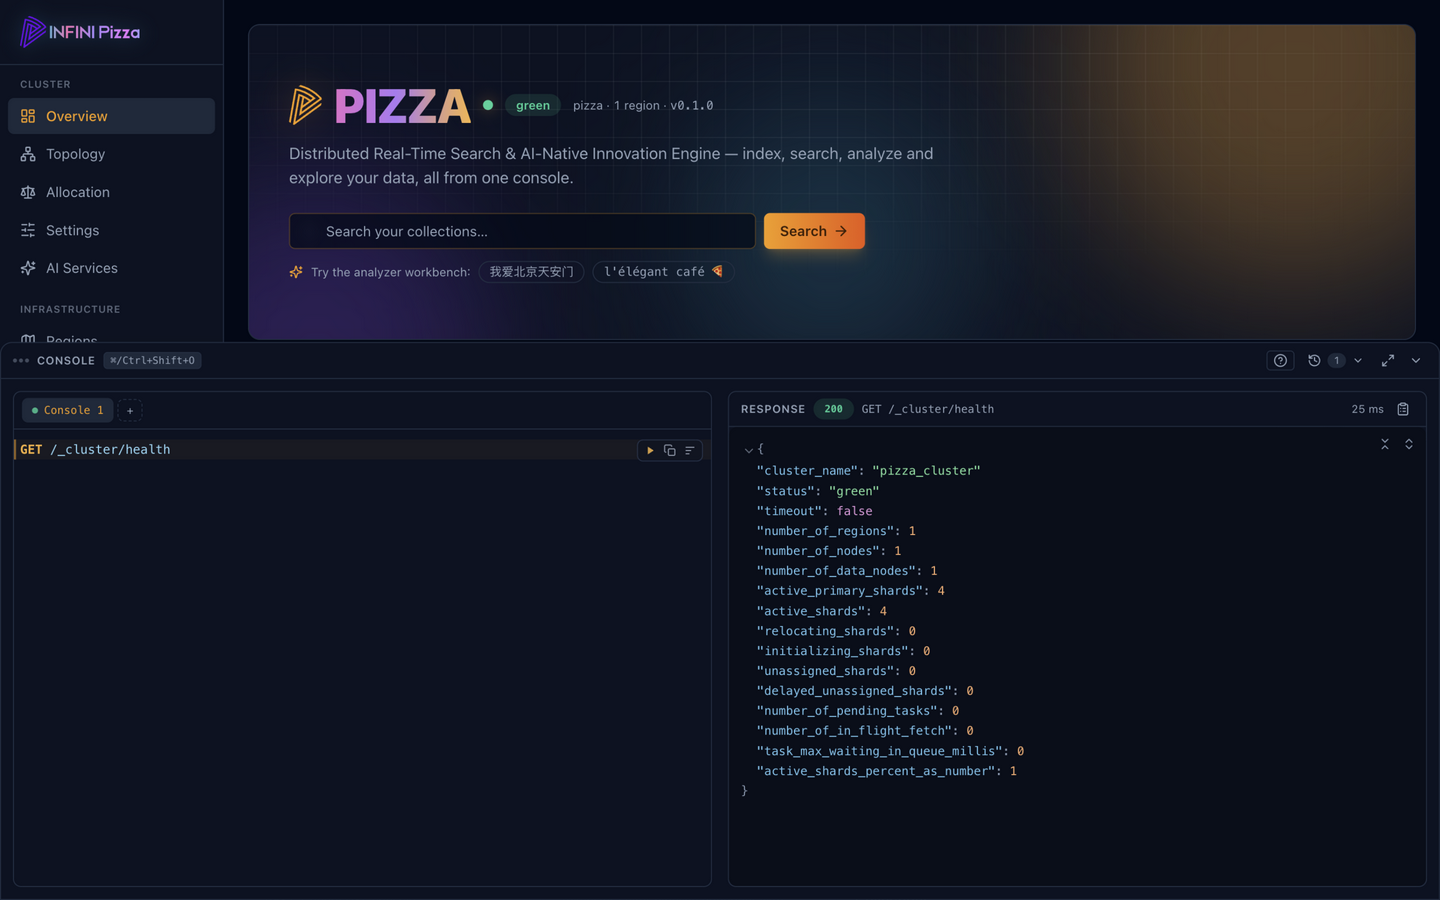
The Tools → Console drawer (summon it from anywhere with
⌘/Ctrl+Shift+O) is a DevTools-style request runner: type METHOD path
plus an optional JSON body, run it with ⌘/Ctrl+Enter, and read the
highlighted, foldable, searchable response. It autocompletes API paths,
live collection and node names, and the Pizza query DSL — and can copy
any request as a curl command.
Text analysis #
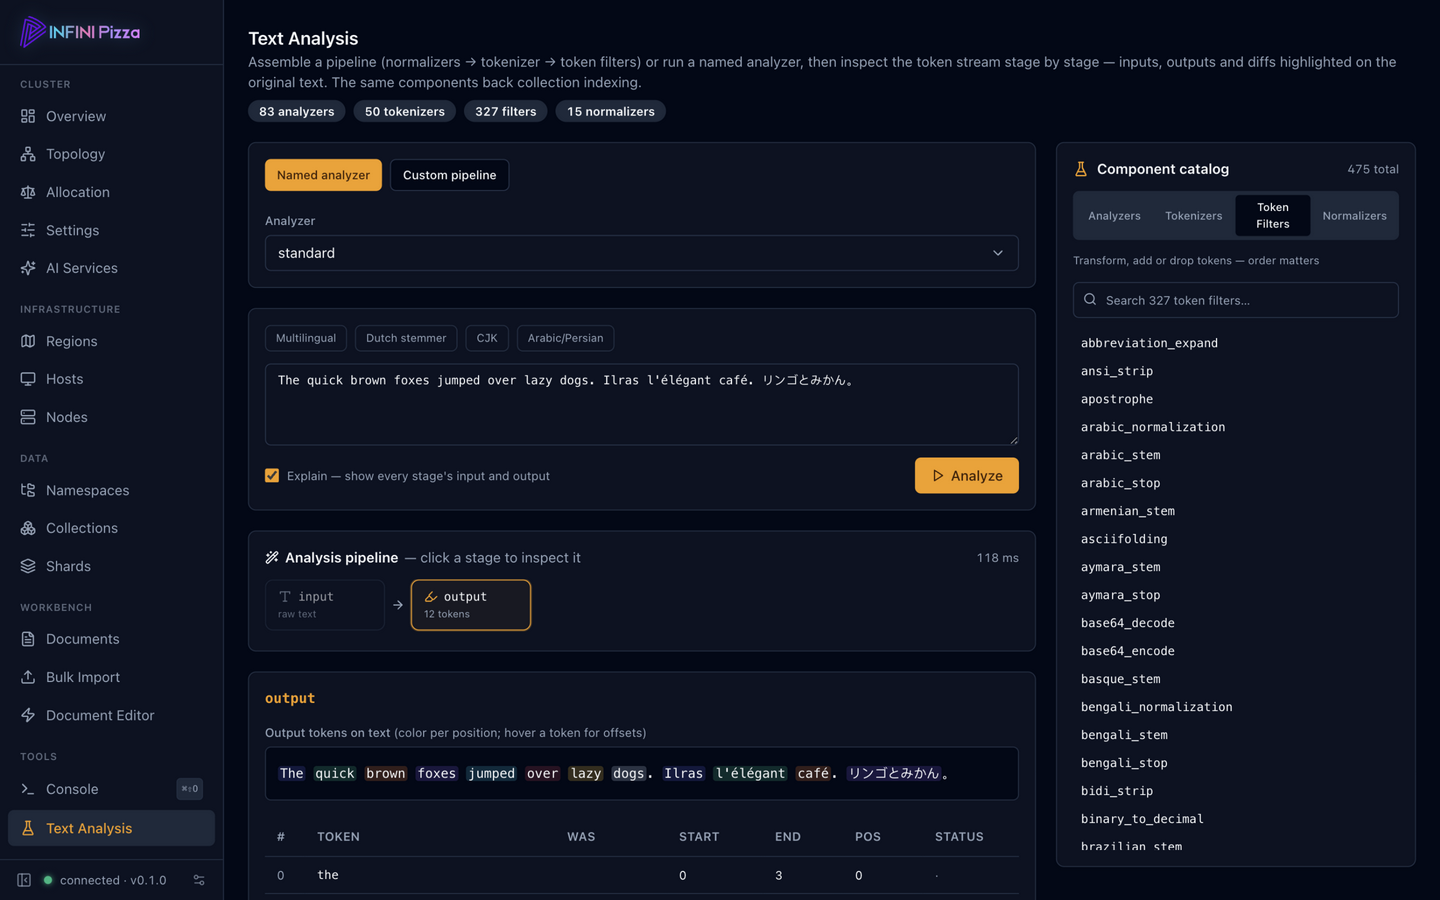
The Text Analysis workbench runs any of the built-in analyzers — or a custom pipeline of normalizers, tokenizer and token filters you assemble from the component catalog — on sample text, and shows the token stream stage by stage with diffs highlighted on the original text. Test a pipeline here before committing it to the schema.
Settings and AI services #
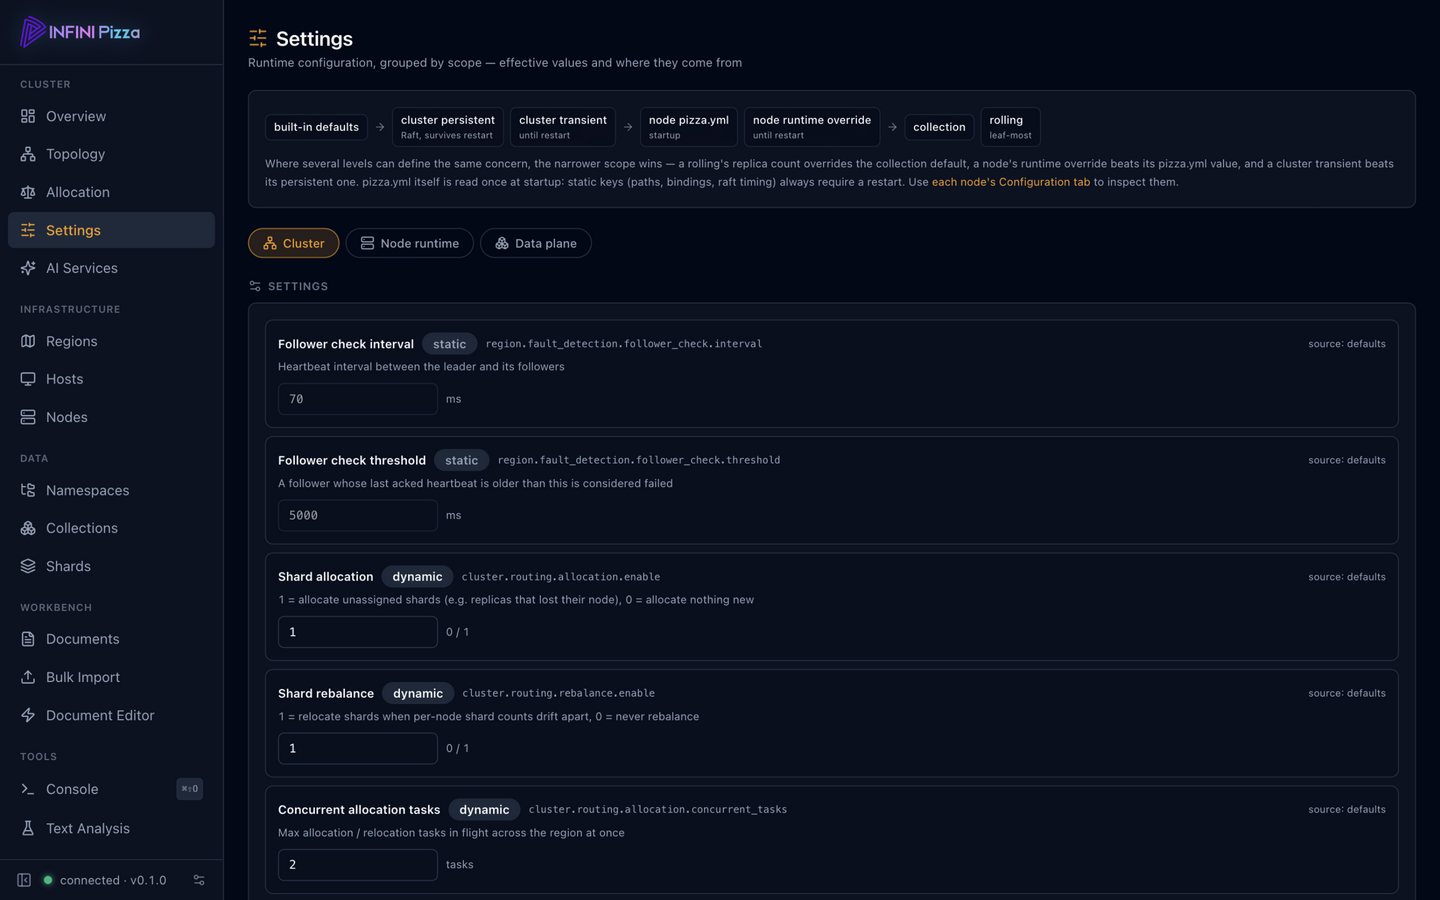
The Settings hub edits cluster and node settings in grouped cards with effective values and static/dynamic category badges — the dynamic ones apply without a restart, fanned out across the cluster for you.
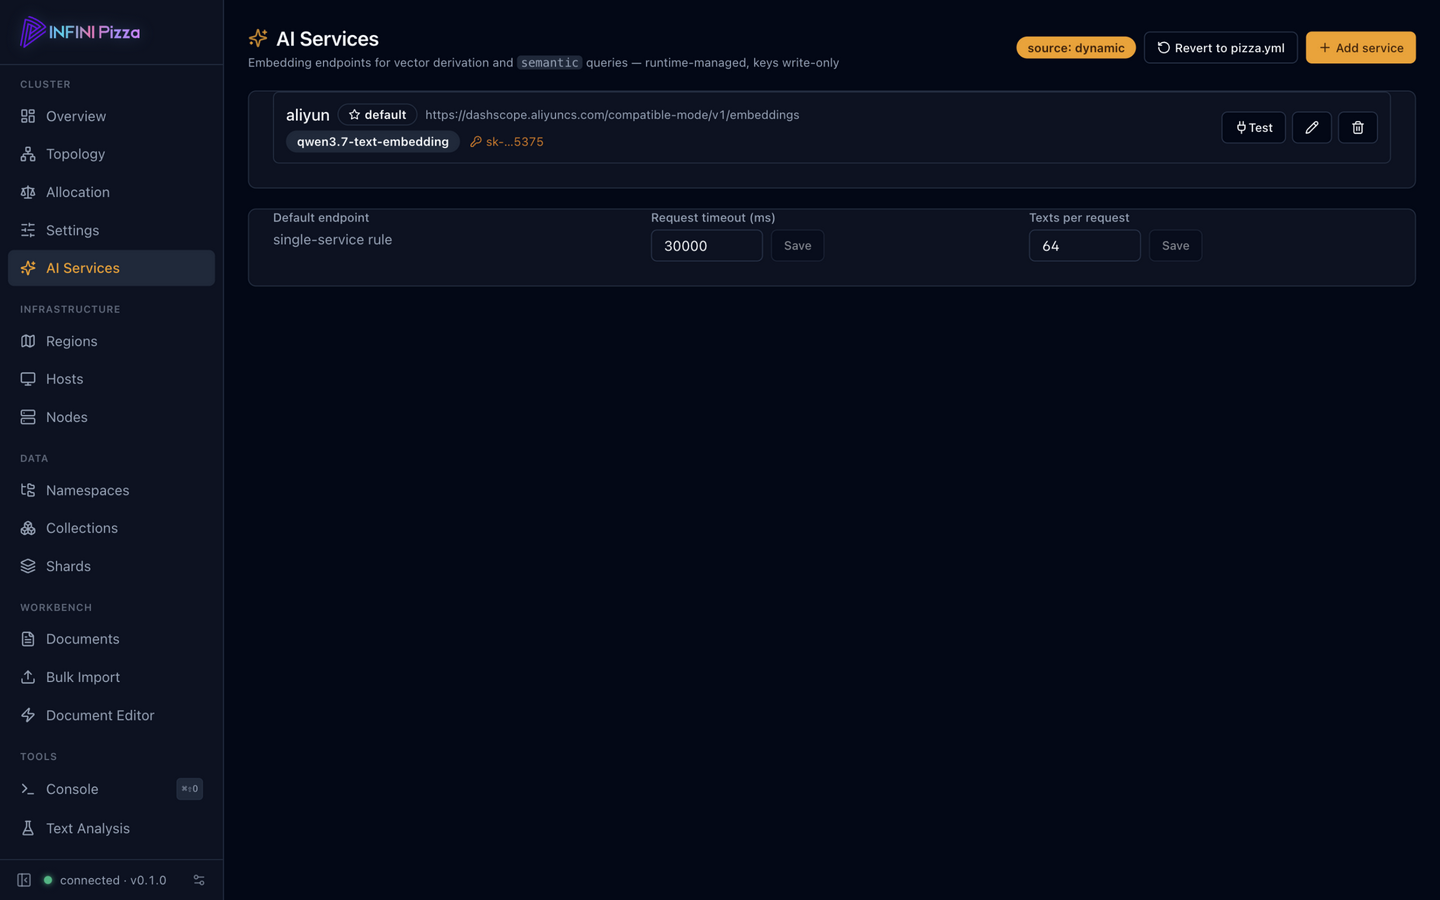
AI Services manages the providers and models used for embeddings and inference at index and query time: add or edit services, list their models, and point collections at them.
Go deeper #
- FIRE storage explorer — see exactly where the bytes of a shard go, per field.
- Node settings — edit node settings from the console instead of config files.