/ Settings,
/ Operations,
/ ObservabilityRuntime node settings and dynamic log level
#
Node-local knobs no longer require a restart. GET/PUT /_node/_local/settings exposes transient overrides over the pizza.yml
values — search lane budgets, the slowlog threshold, the default search
timeout, trash retention — and they take effect immediately:
# drop the slowlog threshold to 200ms on one node, effective immediately
curl -X PUT http://127.0.0.1:28000/_node/_local/settings \
  -H 'Content-Type: application/json' \
  -d '{"node.search.slow_threshold_ms": 200}'
The flagship: log.level flips live — no restart, no dropped requests —
which turns “turn on debug logging on the suspicious node” into a
one-liner while preserving target-specific directives like
openraft=warn.
.../ Node,
/ ObservabilityNode observability APIs
#
The /_node/_local/* surface exposes this node’s runtime state —
recovery progress, build backlog, shard inventory, storage layout,
slowlogs, logs and the trash. All of it is read-only except where noted,
and every endpoint can be reached on a remote node through the
unified forward: replace _local with the node id
(/_node/<node_id>/...) — the console’s node pages are
built on this.
Runtime knobs live on the sibling
Node Settings page.
.../ Console,
/ Storage,
/ ObservabilityFIRE storage explorer in the console
#
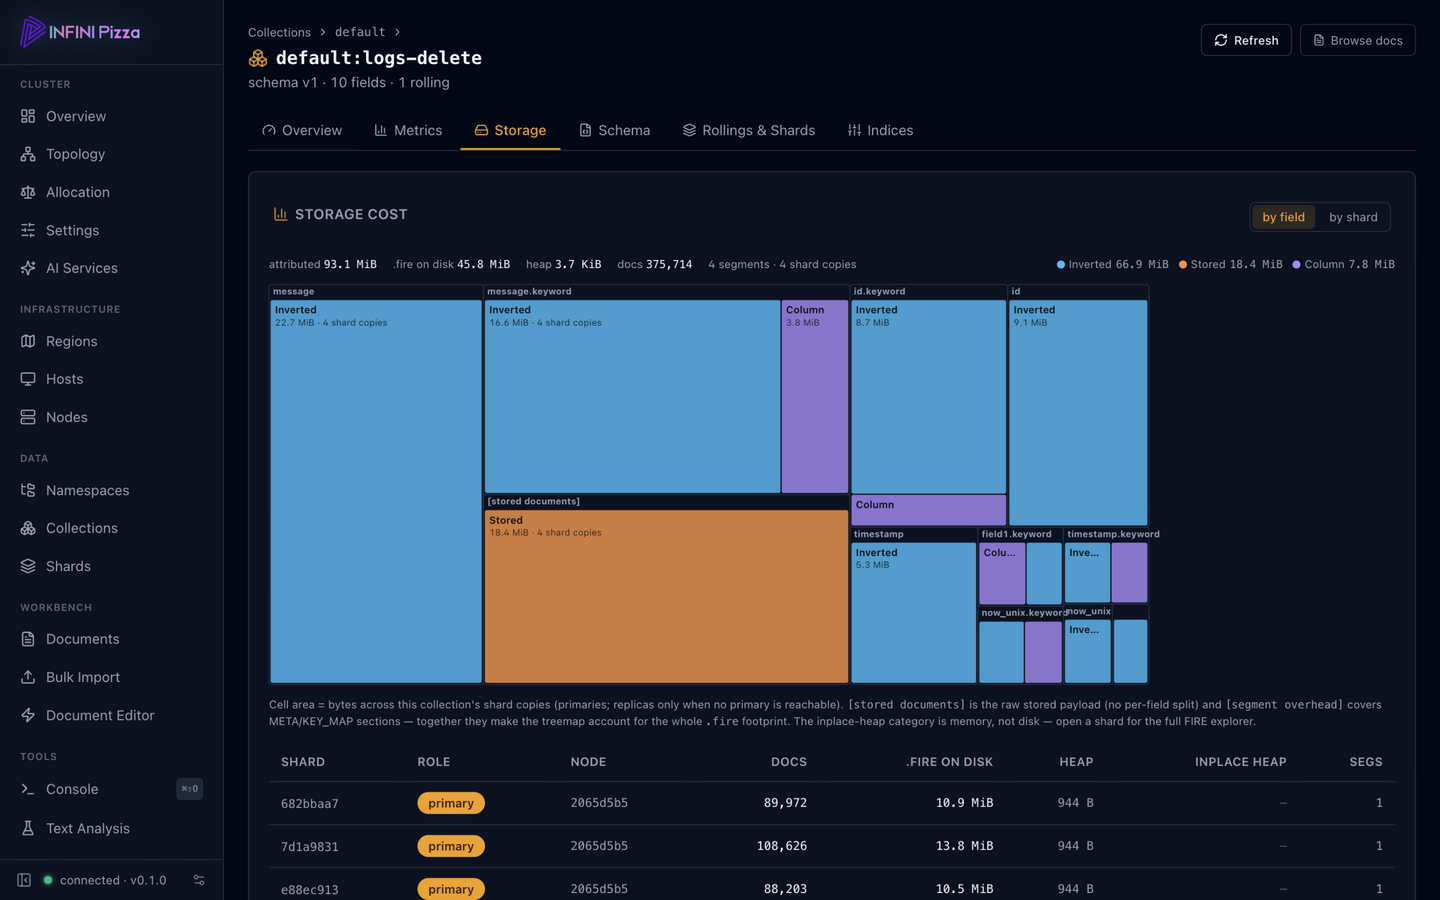
The web console (/_ui/) gained a FIRE storage explorer: drill from a
node’s shards down to a single segment’s .fire files and see exactly
where the bytes go — a per-field cost treemap of the columnar FIRE
storage, next to the inverted index and stored-field payloads. In the
screenshot above, the collection’s Storage tab sizes every field by
its on-disk cost, each block split into storage categories — so the
question “which field is eating my disk” is answered by the biggest
rectangle on screen.
.../ Observability,
/ Operations,
/ ConsoleHost & capability probes — see the machine, not just the node
#
Every node now reports what its host actually is and what it can actually
do, on GET /_node/_local under host: the OS distribution and kernel,
NUMA topology (node count + per-node CPU lists and distances), NIC
inventory with negotiated link speeds, the data disk’s bus (NVMe or not)
with its I/O scheduler and atime policy, the container and seccomp
environment, the DMI platform, transparent-hugepage state — and the
resource ceilings: fd limit vs usage, mmap count vs max_map_count,
swap, conntrack fill, TCP sysctls, and cgroup CPU/memory quotas with
throttle counts. The stats API adds a steal_percent trend — the
noisy-neighbor line on shared tenancy.
...